Öffnet in einem neuen Tab
Innovative Lösungen für die Luftqualität

Pressure Testing, Burst Testing, and Leakage Standards for Water Purifiers: The B2B Buyer’s QC Audit Guide

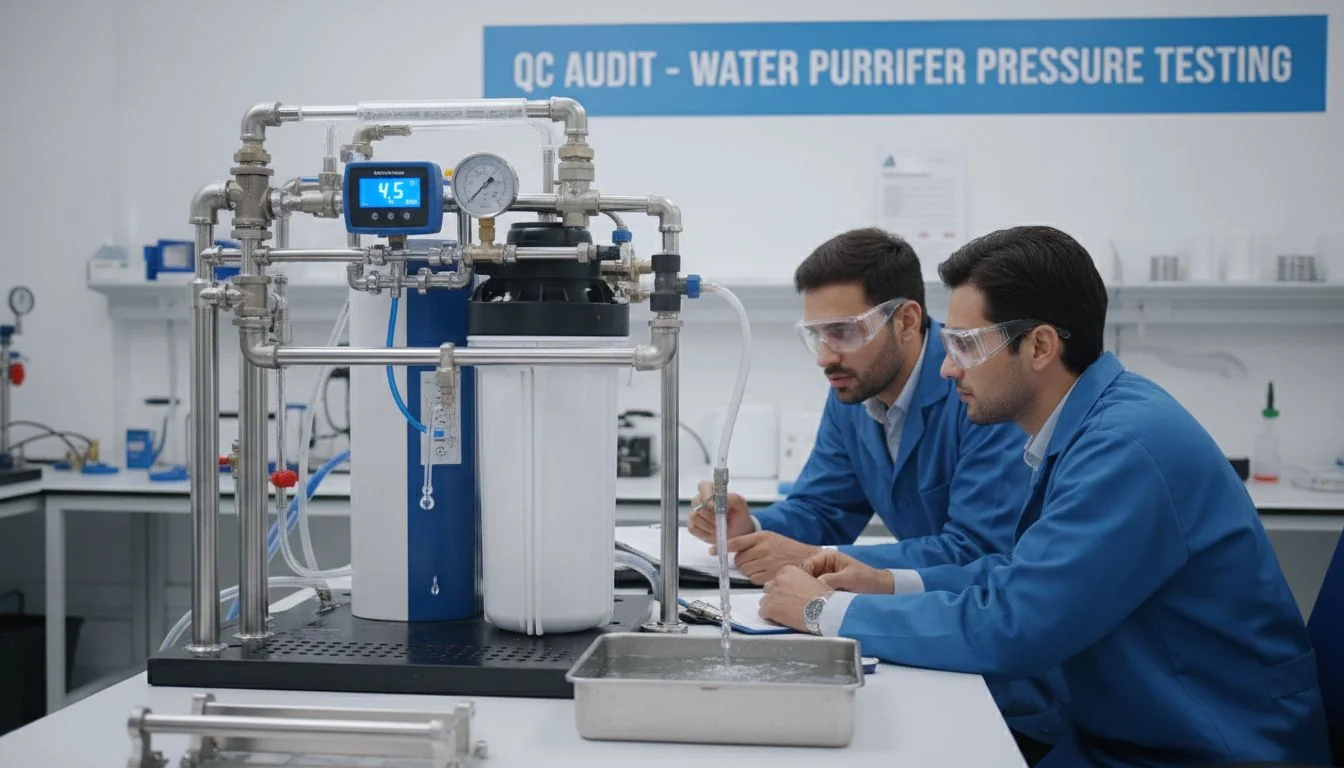
water purifier pressure testing QC audit

Cheap OEM quotes often hide weak pressure performance. A failed water purifier causes floods, property damage, and recalls. You must lock pressure specs early to protect your brand.

pressure testing1 is the most underspecified dimension in water purifier contracts. To audit QC effectively, buyers must enforce four checkpoints: quote-stage spec lock, sample-stage validation, production-stage QC, and field-correlation review. This prevents low-cost manufacturers from cutting corners on housing thickness and component grades.
water purifier OEM quote failure

I learned this the hard way during my early days in the mold industry. Let me show you exactly how to stop these hidden failures before they ruin your product line.

A housing molded 0.4mm thinner than spec will always fail a static pressure test.Falsch

A thinner housing can pass a static test but will fail pressure-cycle fatigue testing much earlier.

Rigorous pressure testing typically adds 1-3% to the cost of goods.Wahr

This small cost covers testing infrastructure, properly rated components, and adequate housing wall thickness.

What Are the Static and Burst Pressure Benchmarks for Different Water Purifier Tiers?

Guessing pressure benchmarks2 leads to disaster. Under-spec, and the product floods a home. Over-spec, and you waste money on parts. You need exact numbers for your target tier.

Static testing holds the system at 1.5 to 2 times the operating pressure to check for leaks. burst testing3 pressurizes the unit until it breaks. Residential systems need a 200-300 psi burst benchmark, while commercial systems require 500-800 psi.
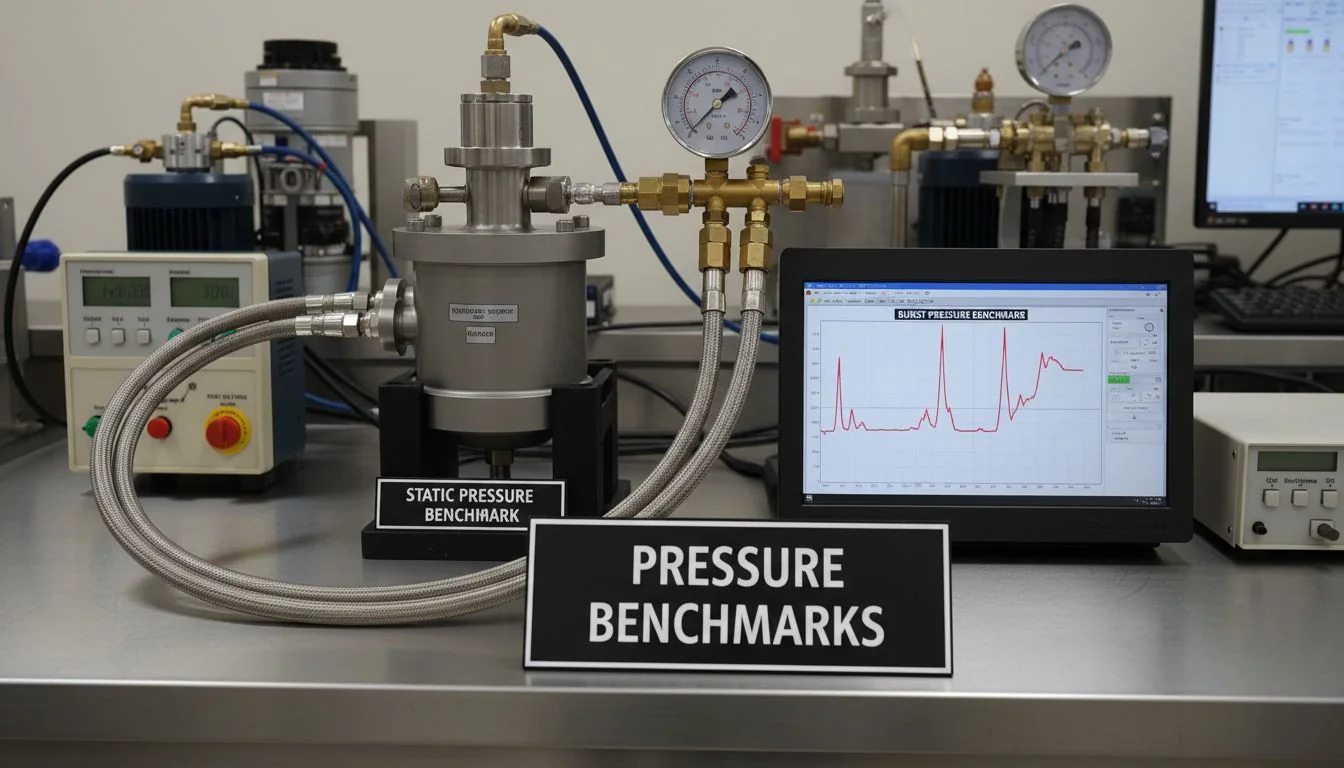
static and burst pressure benchmarks

The Weak-Component Principle

Burst testing often shows a surprising truth. The main housing is rarely the weakest link. Usually, a fitting, an O-ring, or a quick-connect breaks first. The burst pressure of your entire system equals the burst pressure of its weakest part. If you have a strong housing but a cheap quick-connect, the system fails at the quick-connect's limit. This is why you must control component-level pressure ratings just as strictly as your housing design.

Benchmark Ranges by Tier

You must specify the right benchmark in your RFQ. If a manufacturer cannot provide burst test data on sample units, they are hiding something. Do not accept a calculated design burst. You need actual destructive test results. Here is a breakdown of the benchmarks you should demand:

Purifier Tier Operating Pressure Static Test Pressure Burst Benchmark
Wohnen 35–80 psi 120–150 psi 200–300 psi
Light Commercial 100–150 psi 180–250 psi 350–500 psi
Kommerziell 150–250 psi 1.5x Operating 500–800+ psi

Always lock these numbers at the quote stage. This separates a reliable product from a cheap, risky one.

The burst pressure of a water purifier system is determined by its strongest component.Falsch

The burst pressure of a system is determined by its weakest component, such as a fitting or O-ring.

Residential water purifiers typically require a burst pressure benchmark of 200-300 psi.Wahr

This provides a 2.5 to 3 times safety margin above the high end of normal operating pressure.

Why Does Pressure-Cycle Fatigue Testing Predict 5-Year Reliability Better Than Burst Testing?

A great burst number looks good on paper. But real-world water purifiers face thousands of pressure cycles, not one big spike. Skipping fatigue tests guarantees field failures later.

Burst tests only show how much pressure breaks a system once. Pressure-cycle fatigue testing4 simulates real-world use by pressurizing and depressurizing the system thousands of times. A product claiming a 5-year life must survive at least 10,000 cycles to prove its reliability.
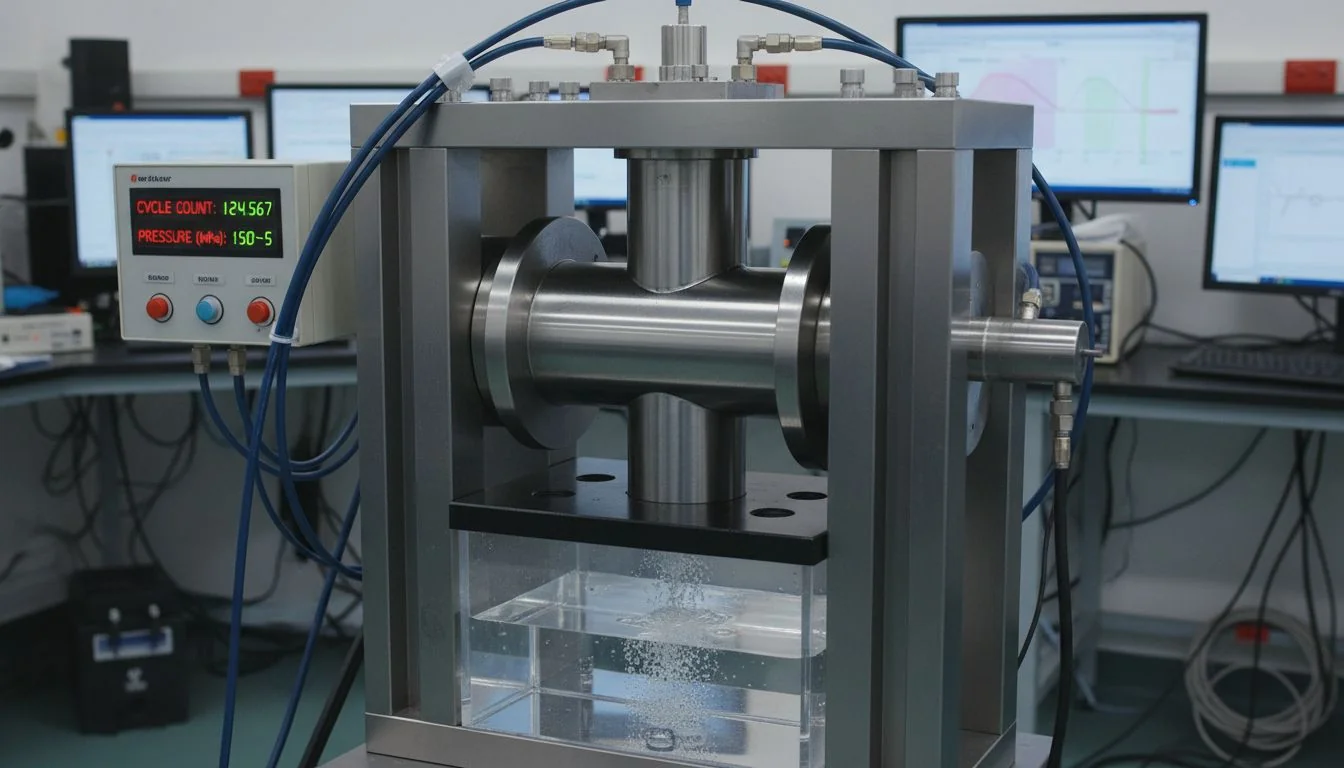
pressure cycle fatigue testing

The Hidden Failures Cycle Testing Reveals

Cycle fatigue testing exposes problems that static and burst tests miss completely. For example, a thin weld line in a molded housing might survive one static test. But after thousands of cycles, that same weld line will crack. O-rings that hold steady under static pressure will slowly degrade and leak under constant cycling. Quick-connects will loosen. Threaded fittings will crack. These are fatigue failures. They happen at pressures far below the single-event burst limit.

Setting the Cycle Benchmark

You must tie your cycle benchmark to the claimed life of the product. A residential RO system cycles multiple times a day. Over five to seven years, that adds up fast.

Claimed Service Life Daily Cycles Minimum Cycle Benchmark Recommended Margin
3 Years 5 5,475 cycles 10,000 cycles
5 Years 5 9,125 cycles 15,000 cycles
7 Years 5 12,775 cycles 20,000+ cycles

Your quality agreement must demand this test. Ask your OEM partner to show you cycle fatigue data on a real product. If they only offer a burst number and a promise, walk away. The cost of this test is tiny compared to a massive recall in year two.

Static testing easily detects weld line fatigue cracking in molded housings.Falsch

Static testing misses fatigue cracking. Only pressure-cycle fatigue testing reveals these long-term material failures.

A water purifier claiming a 5-year service life should validate to at least 10,000 pressure cycles.Wahr

10,000 cycles covers the expected daily pressure changes over a 5-year period with a small safety margin.

Why Can a Passing System-Level Test Hide a Failing Component?

Testing the whole assembled system feels safe. But it creates a massive blind spot. A passing system test can easily hide one weak part that will fail in the field.

System-level tests confirm the assembled product survives, but they do not show the margin of each part. A system might pass at 250 psi, but a quick-connect inside might be on the edge of breaking at 255 psi. component-level testing5 isolates and measures the true strength of every part.
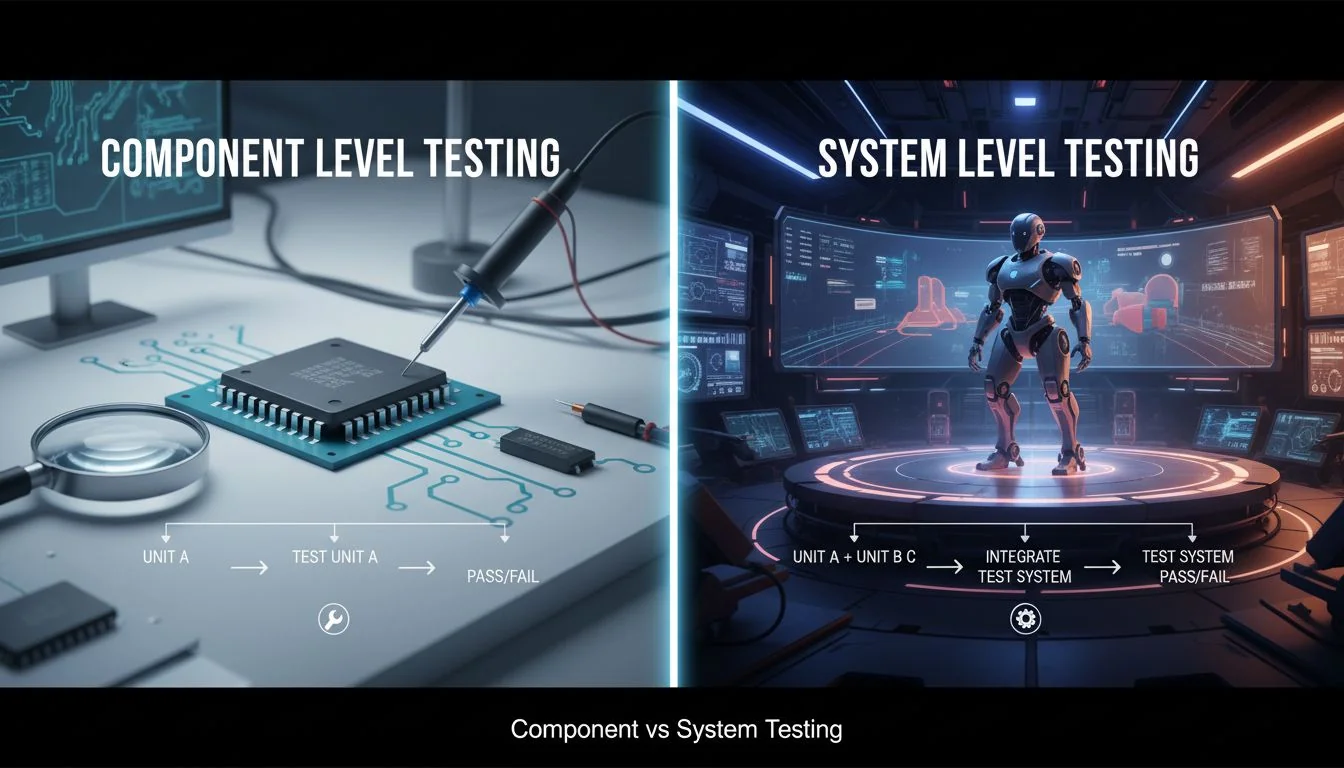
component vs system level testing

The Danger of the Blind Spot

A system-level test only reports the performance of the weakest link. It does not tell you which part that is. It also does not tell you how much safety margin the other parts have. If your system passes a 250 psi test, you might feel good. But if your quick-connect fails at 255 psi, you have almost zero margin. A slight change in production quality will cause that part to fail in a customer's home.

The Combined Testing Strategy

Smart buyers use both methods. You must use component-level testing during the design phase. This helps you balance the pressure path. No single part should be much weaker than the rest. Then, you use system-level testing6 during production to check assembly quality.

Test Type When to Use It What It Validates
Component-Level Design & Qualification Individual part margins and weak points
System-Level Production QC Overall assembly quality and integration
Interface-Level Qualification Specific seal and joint reliability

Leakage is an assembly problem. You must run system-level leak tests on 100% of your production units. Never accept a single system-level pass as proof of a good design. Demand the component-level margin profile.

System-level testing identifies exactly which component has the lowest safety margin.Falsch

System-level testing only shows the failure point of the whole assembly. It does not isolate or identify the margins of individual components.

System-level leak testing should be performed on 100% of production units.Wahr

Leakage is highly sensitive to the assembly process, so every single unit must be checked.

What Are the Test Report Red Flags B2B Buyers Must Catch Before Issuing a PO?

Bad suppliers use tricky test reports to hide weak products. If you cannot read these documents, you will buy a bad product. You must spot the red flags early.

Before issuing a PO, check the test report for calculated burst numbers instead of physical tests. Look for missing cycle fatigue data, sample sizes of one, and tests run too close to normal operating pressure. A missing failure mode description is also a major warning sign.

test report red flags

Spotting Fake Confidence

A test report is a technical document. Many low-cost factories make them look official to trick you. The biggest red flag is a calculated burst pressure. This is just an engineering guess based on material thickness. Real parts have flaws. You need a destructive test on a real physical unit. Another huge red flag is a sample size of one. One unit does not prove the factory can make ten thousand good units.

The Red Flag Checklist

When you review a test report, use this checklist. If you see these issues, ask hard questions before you pay.

Red Flag What It Means What You Should Demand
Calculated Burst No physical test was done Actual destructive test data
No Cycle Data Long-term reliability is unknown 10,000+ cycle fatigue results
Sample Size of 1 Process consistency is unproven Larger sample size across lots
No Failure Mode Factory treats it as a checkbox Exact location and type of break
No 3rd Party Factory might be hiding bad data Independent lab verification

Do not walk away immediately when you see a red flag. Ask for the missing data. A good partner will give it to you. A bad partner will make excuses.

A calculated design burst pressure is just as reliable as a physical destructive burst test.Falsch

Calculated numbers ignore real-world manufacturing variations like wall thickness changes and weld line quality.

A test report should always document the exact location and mode of the failure.Wahr

Knowing how and where a part failed helps engineers improve the design and fix weak points.

Schlussfolgerung

Pressure testing is not just a checkbox. By locking specs early, demanding cycle fatigue data, and spotting report red flags, you ensure your water purifiers survive the real world.


References


  1. Understanding pressure testing is crucial for ensuring the reliability and safety of water purifiers. ↩

  2. Knowing the correct pressure benchmarks is vital for ensuring product safety and compliance. ↩

  3. Burst testing is essential for determining the maximum pressure a water purifier can withstand before failure. ↩

  4. Cycle fatigue testing simulates real-world conditions, revealing potential long-term failures in water purifiers. ↩

  5. Component-level testing helps identify weaknesses in individual parts, ensuring overall product reliability. ↩

  6. System-level testing assesses the performance of the entire assembly, crucial for quality control. ↩

Teilen:
hisoair-gründer herr lee
Alwen Lee, an air purification expert with over 10 years of experience, is a devoted father of two and a passionate traveler, having explored more than 30 countries. With a love for public speaking and swimming, he has dedicated his life to the indoor air quality industry. His mission is to ensure that people around the world enjoy the freedom to breathe clean air and lead happy, healthy lives.

Senden Sie uns eine Nachricht

Mehr zum Lesen

Modern living room with a family enjoying a healthy indoor environment monitored by smart devices, natural lighting, and greenery.

After IFA 2026: The Healthy Home Is Moving Beyond Smart Devices

In our previous IFA 2026 column, Air Purification Is Becoming Part of the Healthy-Home Platform, we argued that the next generation of indoor-health products would ...
Nachrichten
Modern living room and kitchen with smart home air quality devices including an air purifier, humidifier, and water filtration system, connected with visualized blue connectivity lines.

IFA 2026: Air Purification Is Becoming Part of the Healthy-Home Platform

Pre-IFA Industry Perspective | September 4, 2026 This article is based on official announcements and regulatory information available ahead of IFA 2026, which takes place ...
Nachrichten
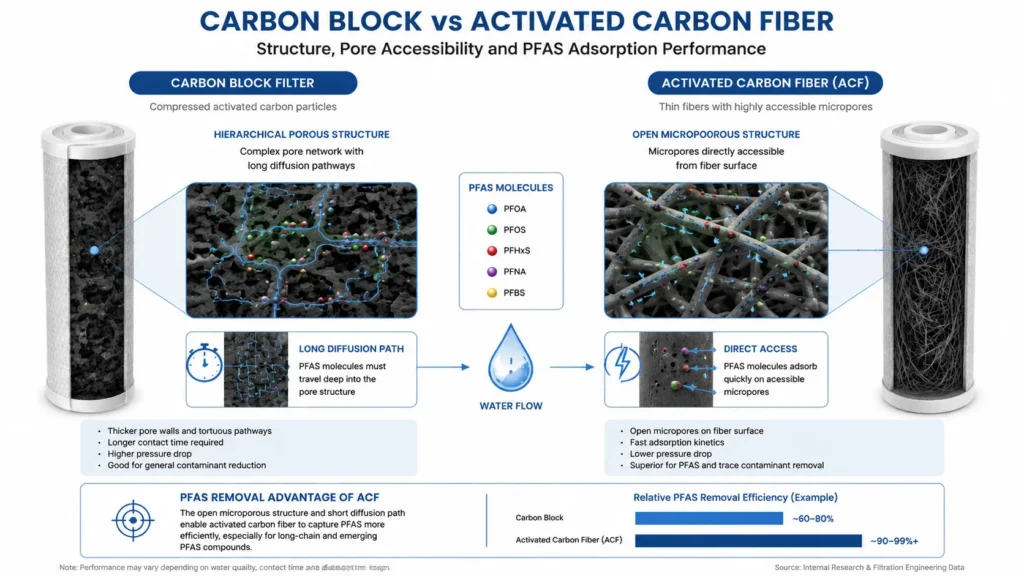
Comparison infographic showcasing the differences between carbon block filter and activated carbon fiber. Detailed diagrams illustrate the hierarchical porous structure of the carbon block with long diffusion paths and the open microporous structure of the activated carbon fiber with direct access for PFAS adsorption.

Carbon Block vs. Activated Carbon Fiber (ACF): Matching Media to Target Contaminants

Two carbon media. Same adsorption chemistry. Very different behaviour in a point-of-use cartridge. If you are specifying a water purifier platform for a PFAS-aware market, ...
Nachrichten
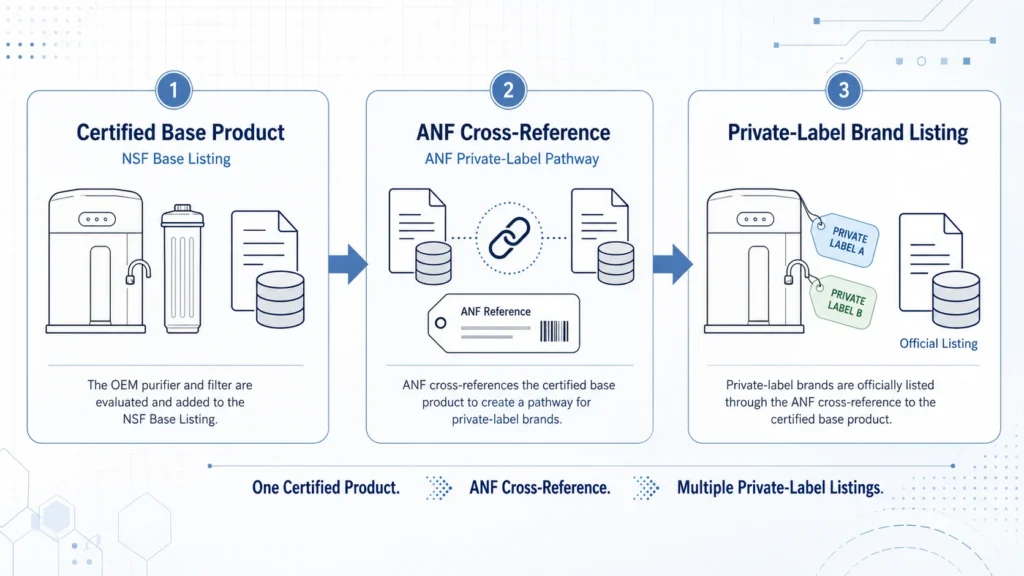
NSF base listing and ANF private-label certification pathway for OEM water filters

What Is an NSF Master Listing? A Guide to Base Listings, ANF Certification and OEM Water Filters

For a brand preparing to launch an OEM water purifier, one of the most common supplier claims is: “We already have an NSF master listing, ...
News, Water Purifiers
Healthy-home brand team reviewing PFAS water filter certification, test data and product engineering

Entering the Water Category Is Easy. Building a Credible PFAS Claim Is Much Harder

For air purification, appliance and healthy-home brands, entering the water category can look surprisingly easy. A company can select an existing undersink system, customize its ...
Nachrichten
Team in a business meeting discussing a water filtration system with product components and a comparison table displayed on a screen.

5 Leading OEM Water Purifier Manufacturers in China for Private Label Brands

China has thousands of companies selling water filters, reverse osmosis systems and drinking-water appliances. However, only a portion of them are suitable for private-label, OEM ...
Nachrichten
Contaminant Engineering•3 min read

PFAS Water Filtration Technologies Explained: Carbon, Resin & RO

Key Takeaway:

PFAS reduction depends on the specific compounds present, treatment media, contact time, water chemistry, and system design. Activated carbon, ion exchange, and Reverse Osmosis address PFAS through different mechanisms.

PFAS are a large family of persistent fluorinated compounds that can occur in drinking-water supplies. Their treatment behavior varies significantly by molecular structure, chain length, functional group, concentration, and the chemistry of the source water.

Granular Activated Carbon (GAC) removes PFAS primarily through adsorption. It is generally more effective for many longer-chain PFAS, while shorter-chain compounds tend to break through more quickly. Carbon performance depends on media properties, Empty Bed Contact Time (EBCT), competing organic matter, loading, and replacement frequency.

Ion-exchange resins use charged functional sites to capture many PFAS compounds. Properly selected anion-exchange media can provide high capacity and may perform better than conventional activated carbon for some shorter-chain PFAS, although performance still depends on water chemistry and competing ions.

Reverse Osmosis (RO) uses membrane separation rather than adsorption. Properly designed RO systems can provide broad reduction across many PFAS compounds as well as dissolved salts and other contaminants. Unlike carbon or resin, however, RO also produces a concentrate stream that must be managed.

No single technology should be selected from a PFAS label alone. System design should consider which PFAS compounds are present, their concentrations, required reduction targets, flow rate, media life, and the applicable third-party certification or validation requirements.

HisoAir Water Technical Series
Product Discovery•3 min read

How to Choose an Under-Sink Water Purifier for Modern Kitchens

Key Takeaway:

Match the treatment technology to your water quality first, then evaluate cabinet space, faucet configuration, flow rate, drain and power requirements, and filter replacement needs.

Choosing an under-sink water purifier starts with water chemistry. Carbon filtration is well suited to chlorine, taste, odor, and many organic contaminants, while Reverse Osmosis is more appropriate when dissolved salts, fluoride, nitrates, or broader dissolved contaminants need to be reduced.

For compact kitchens, tankless RO systems eliminate the conventional storage tank and can significantly reduce the space required under the sink. However, membrane capacity stated in GPD does not directly equal faucet flow. When comparing systems, check the actual dispensing flow rate, inlet-pressure requirement, recovery ratio, and whether a booster pump is required.

Installation architecture also matters. Many RO systems require a drain connection, electrical power, and either a dedicated drinking-water faucet or a compatible multi-function faucet. High-flow carbon systems can often connect directly to the existing cold-water line with a simpler installation, but pressure drop and available faucet flow should still be verified.

RO also removes much of the naturally occurring dissolved mineral content. Where taste or mineral balance is a priority, a post-RO remineralization stage can be added. Filter life should be evaluated by both rated capacity and local water quality rather than replacement time alone.

The right system is therefore not simply the smallest or highest-GPD model. It is the configuration that matches the target contaminants, available cabinet space, desired faucet setup, peak dispensing demand, and maintenance expectations.

HisoAir Water Technical Series
Water Quality•2 min read

What Does TDS Mean in Drinking Water? Measurement vs Contaminant Reality

Key Takeaway:

A TDS meter estimates the overall concentration of dissolved ionic substances from electrical conductivity. It cannot identify specific contaminants or determine whether water is chemically safe.

Total Dissolved Solids (TDS) refers to the combined concentration of dissolved substances in water. Most handheld TDS meters do not measure TDS directly. Instead, they measure electrical conductivity (EC) and convert that reading into an estimated parts-per-million (ppm) value.

This means a TDS reading can indicate how much dissolved ionic material is present, but not what that material actually is. Calcium, magnesium, sodium, nitrates, and other dissolved ions can all contribute to conductivity, yet a simple TDS meter cannot distinguish between them.

TDS meters are also not suitable for detecting trace contaminants such as PFAS, many VOCs, pesticides, pharmaceuticals, or disinfection byproducts. These substances may be present at concentrations far below the level needed to noticeably change electrical conductivity.

A low TDS reading therefore does not guarantee safe drinking water, and a higher TDS reading does not automatically indicate contamination. Water-treatment decisions should be based on laboratory testing for specific contaminants of concern rather than TDS alone.

HisoAir Water Technical Series
Technology Selection•2 min read

RO vs UF Water Filtration: Understanding Pore Sizes & Dissolved Minerals

Key Takeaway:

Ultrafiltration can reduce bacteria, turbidity, and suspended particles while retaining most naturally occurring dissolved minerals. Reverse Osmosis provides much broader reduction of dissolved salts and smaller contaminants.

Ultrafiltration (UF) typically uses hollow-fiber membranes with pore sizes in the approximate 0.01–0.1 micron range. These membranes physically retain turbidity, suspended solids, colloids, and many microorganisms while allowing dissolved minerals and salts to remain in the water.

Reverse Osmosis (RO) operates at a much finer separation level. Unlike UF, RO can substantially reduce dissolved ions such as sodium, calcium, fluoride, nitrates, and other contributors to total dissolved solids (TDS). This makes RO more suitable when dissolved-salt reduction is a primary treatment objective.

UF generally requires less system pressure and produces little or no continuous concentrate stream in many point-of-use configurations. RO typically requires greater pressure and produces a reject-water stream, but delivers broader contaminant reduction.

For water with acceptable TDS and mineral content, UF can be a simpler mineral-retaining treatment option. Where dissolved salts, fluoride, nitrates, or broader dissolved contaminants are a concern, RO is generally the more appropriate technology.

HisoAir Water Technical Series
Technology Selection•4 min read

Carbon Block vs Reverse Osmosis: Which Fits Your Need?

Key Takeaway:

Choose RO for dissolved inorganic salts and heavy metals; choose Carbon Block for chemical taste/odor, no wastewater, and high line-pressure flow.

Reverse Osmosis (RO) and Carbon Block filtration represent two fundamentally different treatment methods: membrane separation and adsorption. Understanding these differences helps determine which technology is better suited to a specific water-quality requirement.

Reverse Osmosis uses a semi-permeable membrane with pore sizes of approximately 0.0001 microns. It can significantly reduce dissolved inorganic contaminants such as TDS, fluoride, nitrates, and certain heavy metals. Because water must be forced through the membrane, RO systems require sufficient pressure or a booster pump and generate a concentrated wastewater stream.

Carbon Block filtration relies primarily on adsorption through compressed activated carbon, commonly with nominal pore sizes around 0.5–5 microns. It is highly effective for chlorine, chloramines, VOCs, taste, and odor, while allowing substantially higher direct-flow rates without producing wastewater.

From an operating perspective, Carbon Block systems are generally simpler, require less energy, and avoid the water loss associated with RO. RO involves higher system complexity and operating cost, but provides substantially broader reduction of dissolved contaminants that Carbon Block alone cannot address.

HisoAir Water Technical Series

EIN ANGEBOT ANFORDERN